observability & production monitoring
Tung Bui Thanh (TungDaDev)15 mins read

Đẩy code lên production mới là bắt đầu thôi. Hệ thống phân tán thì dữ liệu chạy qua cả chục service, qua event bus (Kafka, RabbitMQ) rồi mới tới database. Không có Observability mà vận hành mấy hệ thống kiểu này thì chẳng khác gì chạy tốc độ cao trên cao tốc ban đêm mà tắt đèn pha.
Làm engineer thì xây hệ thống xong chưa phải là hết việc. Còn phải giữ cho nó sống, chạy ổn và tự đứng dậy được khi tải thật đổ vào. Bài này nói về chuyện instrument các Spring Boot service, để mấy cái black box trở nên nhìn xuyên được: đo được, và khi lỗi thì biết lỗi ở đâu.
# three pillars
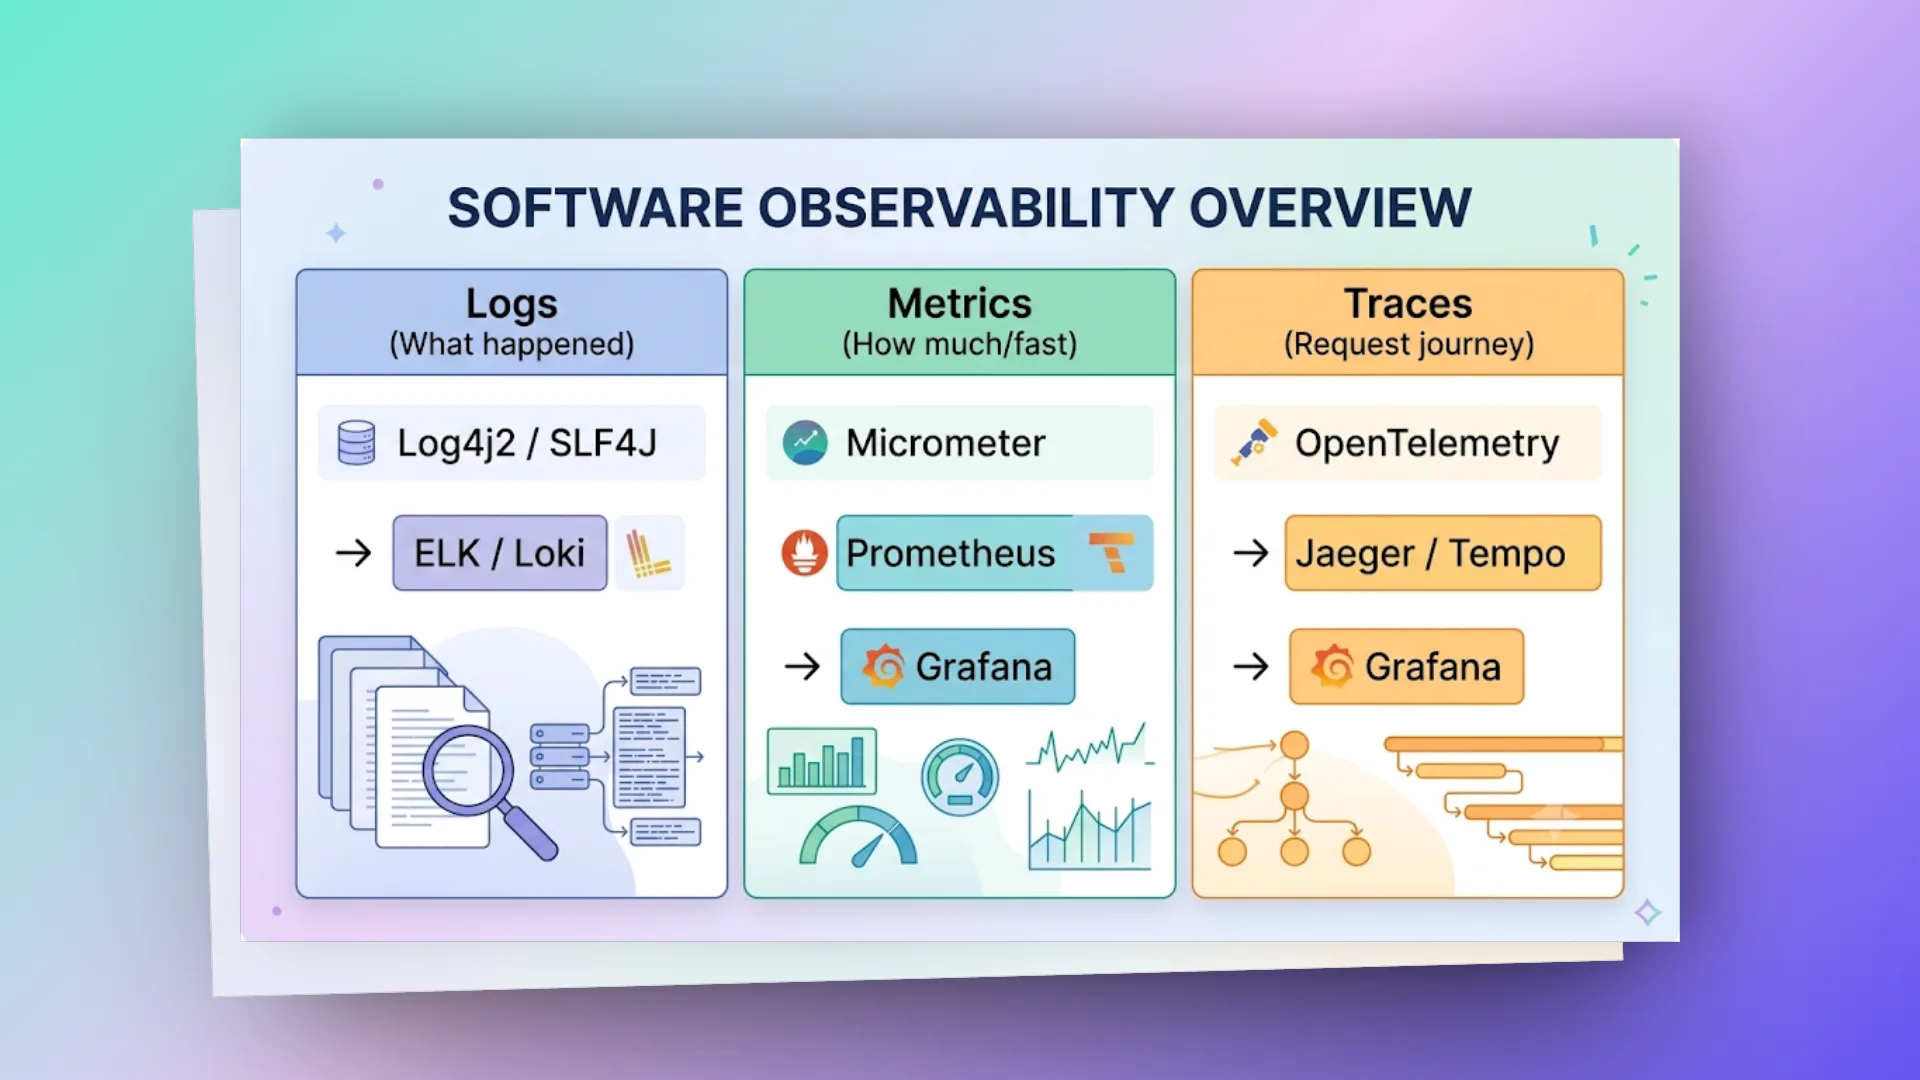
Observability là một đặc tính của hệ thống, chứ không phải một tool cài vào là xong. Nó dựa trên ba trụ cột bổ trợ cho nhau:
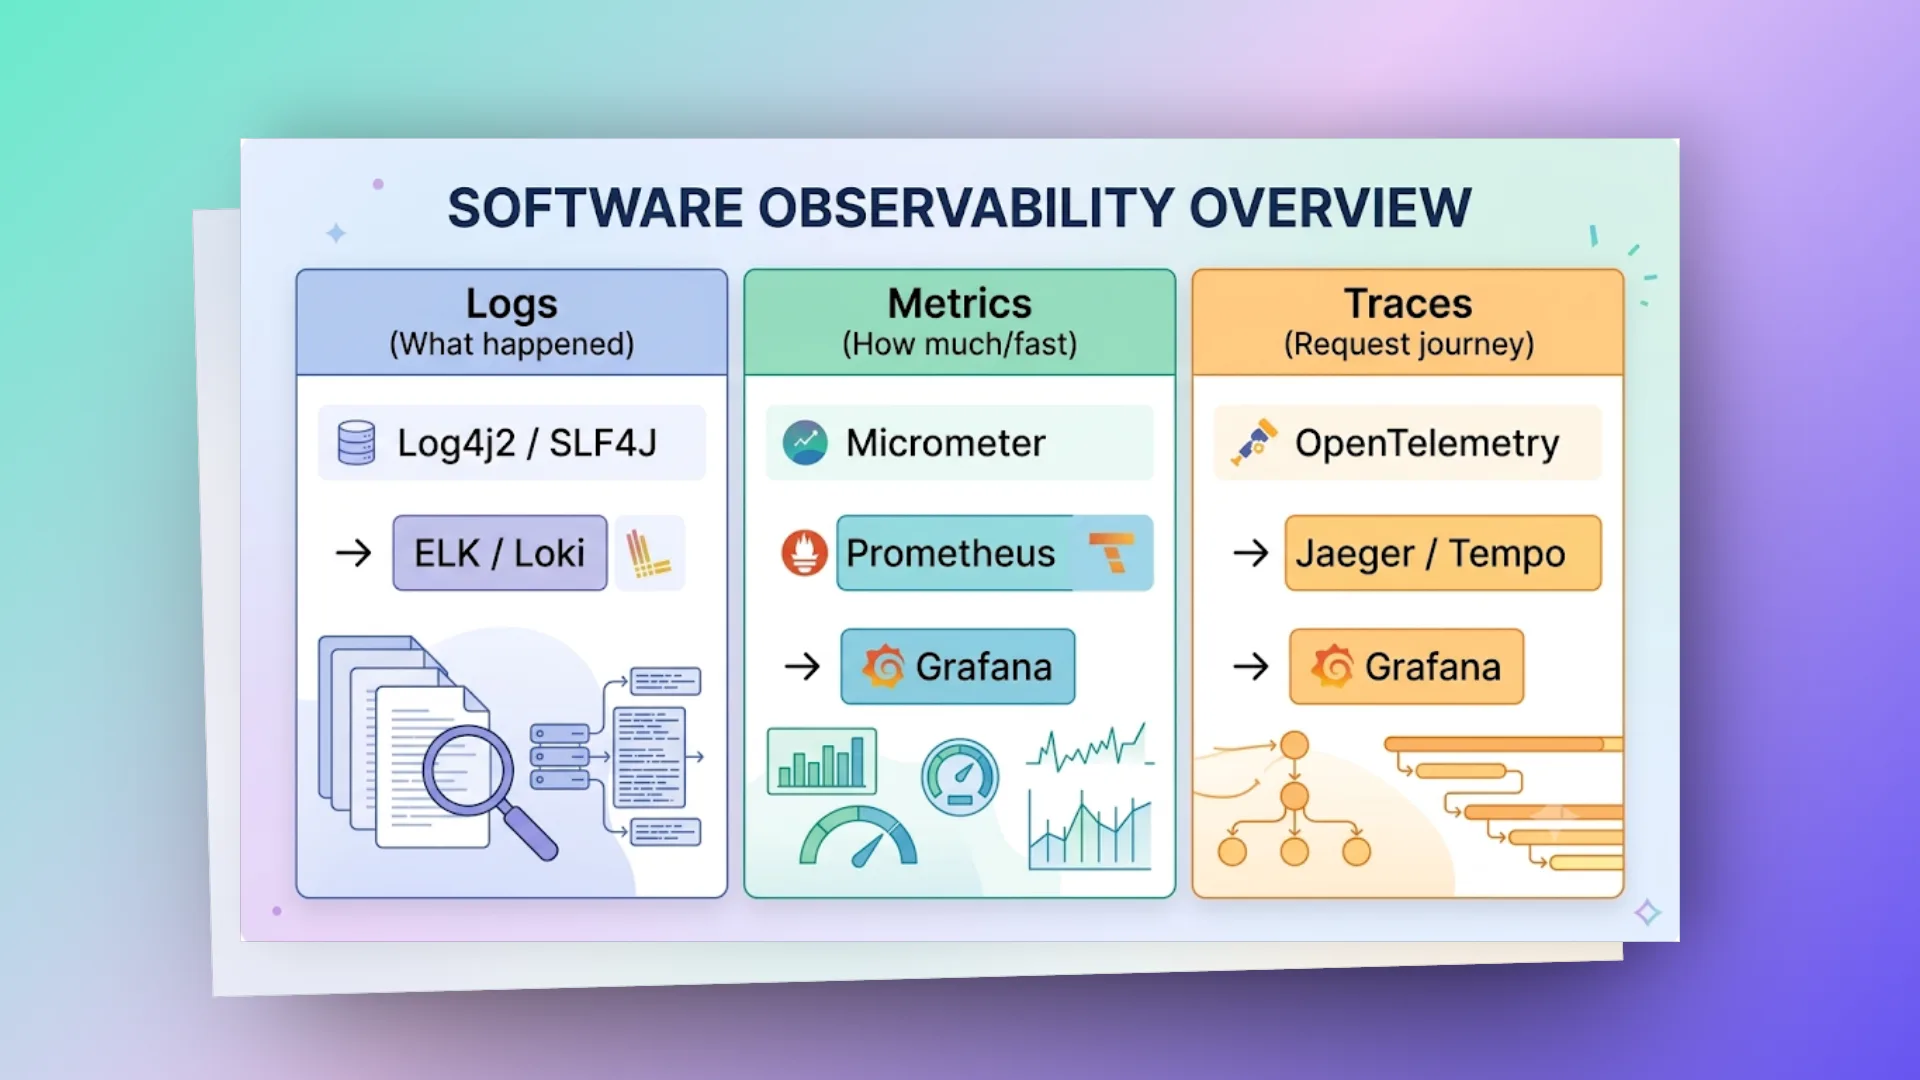
Gỡ lỗi thường đi theo thứ tự: Metrics báo động → dùng Traces khoanh vùng service/hàm có vấn đề → đọc Logs ngay chỗ đó để tìm root cause.
# structured logging
Log text thuần là để người đọc (human-readable). Lên tới scale production thì log phải để máy đọc được (machine-parsable).
# pattern
Bỏ thói quen nối chuỗi (string concatenation) đi, chuyển sang ghi log theo kiểu Key-Value.
// GOOD: structured, traceable, searchable
log.info("[traceId={}] | event=orderCreated | orderId={} | userId={} | amount={}",
   RequestContext.getRequestId(), order.getId(), userId, amount);

// GOOD: separate data fields by |
log.info("[traceId={}] | event=paymentProcessed | transId={} | status={} | duration={}ms",
   traceId, transactionId, status, duration);

// BAD: unstructured, hard to parse
log.info("Order " + order.getId() + " created by user " + userId);

// BAD: logging entire objects (PII risk, noise)
log.info("Processing request: {}", requestDTO); // ← dumps all fields
Nói cho chuẩn thì kiểu key=value | ... ở trên vẫn là log text, chỉ là dễ parse hơn. Log thật sự "structured" là mỗi dòng một object JSON, đẩy vào Loki/Elasticsearch là có field để lọc ngay, không cần viết regex. Từ Spring Boot 3.4 có sẵn structured logging: đặt logging.structured.format.console=ecs (hoặc logstash, gelf) là log ra JSON, kèm luôn traceId/spanId và các giá trị trong MDC.
# log levels guide
| Level | When | Example |
|---|---|---|
| ERROR | System is broken, needs a human | DB connection lost, OOM, critical service down |
| WARN | Unexpected but recoverable | Retry succeeded, fallback used, slow query |
| INFO | Business events, state changes | Order created, user logged in, deployment complete |
| DEBUG | Developer troubleshooting | Method entry/exit, intermediate values |
| TRACE | Very detailed flow | SQL parameters, full request/response bodies |
# production log rules
- Production để level INFO (cần DEBUG thì đổi level lúc runtime)
- KHÔNG log nguyên cả DTO/entity (dính PII, lại dài dòng)
- KHÔNG log password, token, dữ liệu cá nhân
- Dòng log nào cũng phải có traceId
- Ngăn các trường bằng
|để dễ parse - Ở mỗi ranh giới service, log cả request IN lẫn response OUT
# mdc (mapped diagnostic context)
Request chạy concurrent, log đan xen nhau, vậy làm sao gom được log của cùng một request?
→ Dùng MDC. Set MDC một lần ở Filter/Interceptor, sau đó mọi log lines trong thread đó tự có các giá trị này.
// Set once in filter → available in all logs within request
try {
    MDC.put("traceId", requestId);
    MDC.put("userId", jwt.getSubject());
    MDC.put("service", "order-service");
    chain.doFilter(request, response);
} finally {
    MDC.clear();  // thread trả về pool, không clear thì request sau "thừa kế" userId cũ
}

// Log4j2 pattern includes MDC automatically
// %X{traceId} %X{userId} trong log pattern
MDC gắn với thread (ThreadLocal), nên có hai chỗ hay sai. Một là quên clear ở finally, log của request sau mang nhầm userId của request trước. Hai là chuyển việc sang thread khác (@Async, CompletableFuture, executor tự tạo) thì MDC không tự đi theo, phải copy qua bằng TaskDecorator. Nếu đã dùng Micrometer Tracing thì traceId/spanId được nó tự đưa vào MDC, khỏi put tay.
# log4j2 configuration
<Configuration>
   <Properties>
       <Property name="LOG_PATTERN">
           %d{yyyy-MM-dd HH:mm:ss.SSS} [%pid] [%t] %-5level %logger{36}.%M(%L) - %msg%n
       </Property>
   </Properties>

   <Appenders>
       <RollingFile name="File" fileName="logs/application.log"
                    filePattern="logs/application-%d{yyyy-MM-dd}-%i.log">
           <PatternLayout pattern="${LOG_PATTERN}"/>
           <Policies>
               <TimeBasedTriggeringPolicy interval="1"/>
               <SizeBasedTriggeringPolicy size="100MB"/>
           </Policies>
           <DefaultRolloverStrategy max="30"/>
       </RollingFile>
   </Appenders>

   <Loggers>
       <!-- Async logger for performance (cần thêm dependency com.lmax:disruptor) -->
       <AsyncRoot level="info" includeLocation="true">
           <AppenderRef ref="File"/>
       </AsyncRoot>

       <!-- Reduce noise from frameworks -->
       <Logger name="org.hibernate.SQL" level="info"/> <!-- đổi sang debug ở dev để xem SQL -->
       <Logger name="org.springframework.web" level="warn"/>
       <Logger name="com.netflix.eureka" level="warn"/>
   </Loggers>
</Configuration>
Vài điểm cần biết với config này. Spring Boot mặc định dùng Logback, muốn dùng Log4j2 phải exclude spring-boot-starter-logging và thêm spring-boot-starter-log4j2. %M(%L) (tên method, số dòng) cần location info: với async logger phải bật includeLocation="true", không thì ra dấu ?, và bật lên thì tốn CPU vì mỗi dòng log phải lấy stack trace. Còn DefaultRolloverStrategy max="30" là tối đa 30 file %i trong một ngày, không phải giữ 30 ngày. Muốn xoá log cũ theo tuổi thì thêm action <Delete> với IfLastModified age="30d".
# metrics (micrometer + prometheus)
Logs cho bạn nhìn cận cảnh (micro), còn Metrics cho bạn nhìn toàn cảnh (macro). Ở đây mình dùng Micrometer (coi nó như SLF4J nhưng cho metrics) đi cùng Prometheus.
# spring boot actuator setup
Spring Boot Actuator có sẵn các metrics nền (JVM, HTTP, HikariCP). Nhưng muốn hiểu app đang chạy ra sao thì phải đo cả business logic:
management:
  endpoints:
    web:
      exposure:
        include: health, info, prometheus, metrics
  endpoint:
    health:
      show-details: when-authorized
  metrics:
    tags:
      application: ${spring.application.name}
      environment: ${spring.profiles.active:dev}
    distribution:
      percentiles-histogram:
        http.server.requests: true # cần cho histogram_quantile ở phần alert
  prometheus:
    metrics:
      export:
        enabled: true # mặc định đã true khi có micrometer-registry-prometheus
Endpoint /actuator/prometheus chỉ có khi thêm dependency io.micrometer:micrometer-registry-prometheus. Từ Spring Boot 3.0, property bật/tắt export đổi từ management.metrics.export.prometheus.enabled sang management.prometheus.metrics.export.enabled.
# built-in metrics (auto-collected)
# JVM
jvm_memory_used_bytes{area="heap"}
jvm_threads_live_threads
jvm_gc_pause_seconds

# HTTP
http_server_requests_seconds_count{method="GET", uri="/api/orders", status="200"}
http_server_requests_seconds_sum
http_server_requests_seconds_max

# Database
hikaricp_connections_active
hikaricp_connections_idle
hikaricp_connections_pending

# Cache
cache_gets_total{cache="users", result="hit"}
cache_gets_total{cache="users", result="miss"}
# custom business metrics
@Service
public class OrderService {  // không dùng @RequiredArgsConstructor: đã có constructor tự viết
   private final MeterRegistry meterRegistry;
   private final Counter orderCreatedCounter;
   private final Timer orderProcessingTimer;

   public OrderService(MeterRegistry registry) {
       this.meterRegistry = registry;
       this.orderCreatedCounter = Counter.builder("orders.created")
           .description("Total orders created")
           .tag("service", "order-service")
           .register(registry);
       this.orderProcessingTimer = Timer.builder("orders.processing.duration")
           .description("Order processing time")
           .publishPercentiles(0.5, 0.95, 0.99)
           .register(registry);
   }

   public Order createOrder(CreateOrderDTO dto) {
       return orderProcessingTimer.record(() -> {
           Order order = processOrder(dto);
           orderCreatedCounter.increment();
           meterRegistry.counter("orders.created.by_type",
               "type", order.getType().name()).increment();
           return order;
       });
   }
}
Lưu ý publishPercentiles(...) tính percentile ngay trong từng instance, các con số đó không cộng gộp được giữa nhiều pod (trung bình P99 của 5 pod không phải P99 của cả service). Chạy nhiều instance với Prometheus thì nên dùng publishPercentileHistogram() rồi tính bằng histogram_quantile phía Prometheus. Tag như type chỉ nên nhận vài giá trị cố định, đừng gắn orderId hay userId vào tag: mỗi giá trị là một time series mới, Prometheus sẽ phình ra rất nhanh.
# metric types
| Type | Use Case | Example |
|---|---|---|
| Counter | Events that only increase | Requests received, errors occurred, orders created |
| Gauge | Current value (up/down) | Active connections, queue size, memory used |
| Timer | Duration of events | Request latency, DB query time, processing duration |
| Distribution Summary | Distribution of values | Request sizes, payload sizes |
// Counter — only goes up
Counter.builder("emails.sent")
   .tag("type", "confirmation")
   .register(registry)
   .increment();

// Gauge — current state
Gauge.builder("queue.size", queue, Queue::size)
   .register(registry);

// Timer — measure duration
Timer.builder("db.query.duration")
   .tag("query", "findByStatus")
   .publishPercentiles(0.5, 0.95, 0.99)
   .register(registry);

// Distribution Summary — value distribution
DistributionSummary.builder("http.request.size")
   .baseUnit("bytes")
   .publishPercentiles(0.5, 0.95)
   .register(registry)
   .record(requestBody.length);
# custom health indicators
@Component
public class ExternalServiceHealthIndicator implements HealthIndicator {

   @Override
   public Health health() {
       try {
           boolean reachable = checkExternalService();
           if (reachable) {
               return Health.up()
                   .withDetail("service", "payment-gateway")
                   .withDetail("responseTime", "45ms")
                   .build();
           }
           return Health.down()
               .withDetail("service", "payment-gateway")
               .withDetail("error", "Connection refused")
               .build();
       } catch (Exception e) {
           return Health.down(e).build();
       }
   }
}
# distributed tracing (opentelemetry)
Với microservices, một request từ Client có thể đi qua API Gateway → Service A → RabbitMQ → Service B. Lần theo bằng tay thì chịu chết.
OpenTelemetry (OTel) và chuẩn W3C Trace Context làm ra để xử lý chuyện này. Cả vòng đời request dùng chung một TraceId, còn mỗi chặng xử lý (hop) có một SpanId riêng.
# configuration
management:
  tracing:
    sampling:
      probability: 0.1 # 10% in prod, 1.0 in dev
    propagation:
      type: w3c # W3C TraceContext headers

  # Export to collector (Spring Boot 3.x + micrometer-tracing-bridge-otel + opentelemetry-exporter-otlp)
  # Spring Boot 4 đổi thành management.opentelemetry.tracing.export.otlp.endpoint
  otlp:
    tracing:
      endpoint: http://otel-collector:4318/v1/traces
  opentelemetry:
    resource-attributes:
      deployment.environment: ${spring.profiles.active:dev}
# service.name lấy từ spring.application.name
Nhóm property otel.exporter.otlp.* mà nhiều bài trên mạng hay dùng là của OpenTelemetry Java agent hoặc OpenTelemetry Spring Boot starter, không phải của Spring Boot Actuator. Trộn hai cách thì dễ thành cấu hình không có tác dụng.
Cấu hình xong là Spring Boot tự gắn trace context vào HTTP headers khi gọi qua RestTemplate/RestClient/WebClient được tạo từ builder của Spring. Kafka và RabbitMQ thì phải bật thêm observation-enabled cho template và listener. JDBC không có sẵn, cần thư viện như datasource-micrometer. @Async muốn giữ trace thì executor phải dùng ContextPropagatingTaskDecorator. Phần bạn phải lo là truyền TraceContext cho đúng khi gọi qua giao thức custom mà framework không hỗ trợ sẵn.
# auto-instrumentation (zero-code)
Spring Boot 3.2 + Micrometer Tracing instrument được (một số mục cần bật thêm như ghi chú):
- HTTP requests (inbound + outbound qua client tạo từ builder của Spring)
- JDBC queries (cần thêm
datasource-micrometer) - Redis commands (Lettuce)
- Kafka/RabbitMQ publish/consume (bật
observation-enabled) - gRPC calls (qua thư viện gRPC có hỗ trợ Micrometer, như Spring gRPC)
@Asyncmethods (cầnContextPropagatingTaskDecorator)@Scheduledtasks (Spring Framework 6.1+)
# manual span creation
@Service
@RequiredArgsConstructor
public class PaymentService {
   private final ObservationRegistry observationRegistry;

   public PaymentResult processPayment(PaymentRequest request) {
       return Observation.createNotStarted("payment.process", observationRegistry)
           .lowCardinalityKeyValue("payment.type", request.getType().name())
           .highCardinalityKeyValue("payment.id", request.getId().toString())
           .observe(() -> {
               // Auto-creates span with timing
               validate(request);
               PaymentResult result = callGateway(request);
               persistResult(result);
               return result;
           });
   }
}

// Or with Tracer directly
@Service
@RequiredArgsConstructor
public class ImportService {
   private final Tracer tracer;

   public void importBatch(List<Record> records) {
       Span span = tracer.nextSpan().name("import.batch").start();
       try (Tracer.SpanInScope ws = tracer.withSpan(span)) {
           span.tag("batch.size", String.valueOf(records.size()));
           records.forEach(this::importRecord);
           span.tag("batch.result", "success");
       } catch (Exception e) {
           span.error(e);
           throw e;
       } finally {
           span.end();
       }
   }
}
# trace propagation across services
// HTTP client — auto-propagated via WebClient/RestClient instrumentation
// RabbitMQ — propagated via message headers
// Manual propagation (e.g., custom protocol): dùng bean io.micrometer.tracing.propagation.Propagator,
// đừng tự ghép header.
// traceId() chỉ là một phần; header W3C đầy đủ là traceparent = 00-<traceId>-<spanId>-<flags>
Map<String, String> headers = new HashMap<>();
Span current = tracer.currentSpan();  // có thể null nếu không nằm trong span nào
if (current != null) {
    propagator.inject(current.context(), headers, Map::put);  // điền "traceparent" (+ "tracestate")
}
// Gửi các header này kèm request; bên nhận dùng propagator.extract(...) để nối tiếp trace
# alerting strategy
Metrics ngon mà Alert dở (báo giả liên tục) thì cả team sẽ bị "Alert Fatigue": chai lì, cảnh báo kêu cũng chẳng ai thèm nhìn.
# alert severity levels
| Severity | Response Time | Example |
|---|---|---|
| P1 (Critical) | < 5 min | Service down, data loss, auth broken |
| P2 (High) | < 30 min | High error rate (>5%), latency spike, DB connection exhausted |
| P3 (Medium) | < 4 hours | Elevated error rate (>1%), queue growing, memory trending up |
| P4 (Low) | Next business day | Disk usage >70%, deprecated API still in use |
# key alerts (prometheus/grafana)
# Error rate > 5% for 5 minutes
- alert: HighErrorRate
  expr: |
    sum(rate(http_server_requests_seconds_count{status=~"5.."}[5m]))
    / sum(rate(http_server_requests_seconds_count[5m])) > 0.05
  for: 5m
  labels:
    severity: P2

# P95 latency > 2 seconds
- alert: HighLatency
  expr: |
    histogram_quantile(0.95, sum by (le) (rate(http_server_requests_seconds_bucket[5m]))) > 2
  for: 5m
  labels:
    severity: P2

# DB connection pool exhausted
- alert: DbPoolExhausted
  expr: hikaricp_connections_pending > 0
  for: 2m
  labels:
    severity: P1

# Service health check down
- alert: ServiceDown
  expr: up{job="order-service"} == 0
  for: 1m
  labels:
    severity: P1

# JVM heap > 85%
- alert: HighMemoryUsage
  expr: |
    sum by (instance) (jvm_memory_used_bytes{area="heap"})
    / sum by (instance) (jvm_memory_max_bytes{area="heap"}) > 0.85
  for: 10m
  labels:
    severity: P3

# Queue growing (messages not consumed)
- alert: QueueBacklog
  expr: rabbitmq_queue_messages > 10000
  for: 10m
  labels:
    severity: P3
Mấy rule này là phần rules: bên trong một groups: của file rule Prometheus. Hai chỗ dễ sai: metric jvm_memory_* có label id theo từng vùng nhớ (Eden, Survivor, Old Gen), không sum thì mỗi vùng thành một tỉ lệ riêng, alert kêu lung tung; còn histogram_quantile phải sum by (le) thì mới ra P95 của cả service thay vì của từng instance/URI, và chỉ có dữ liệu _bucket khi đã bật percentiles-histogram như ở phần cấu hình Actuator.
# production dashboards (grafana)
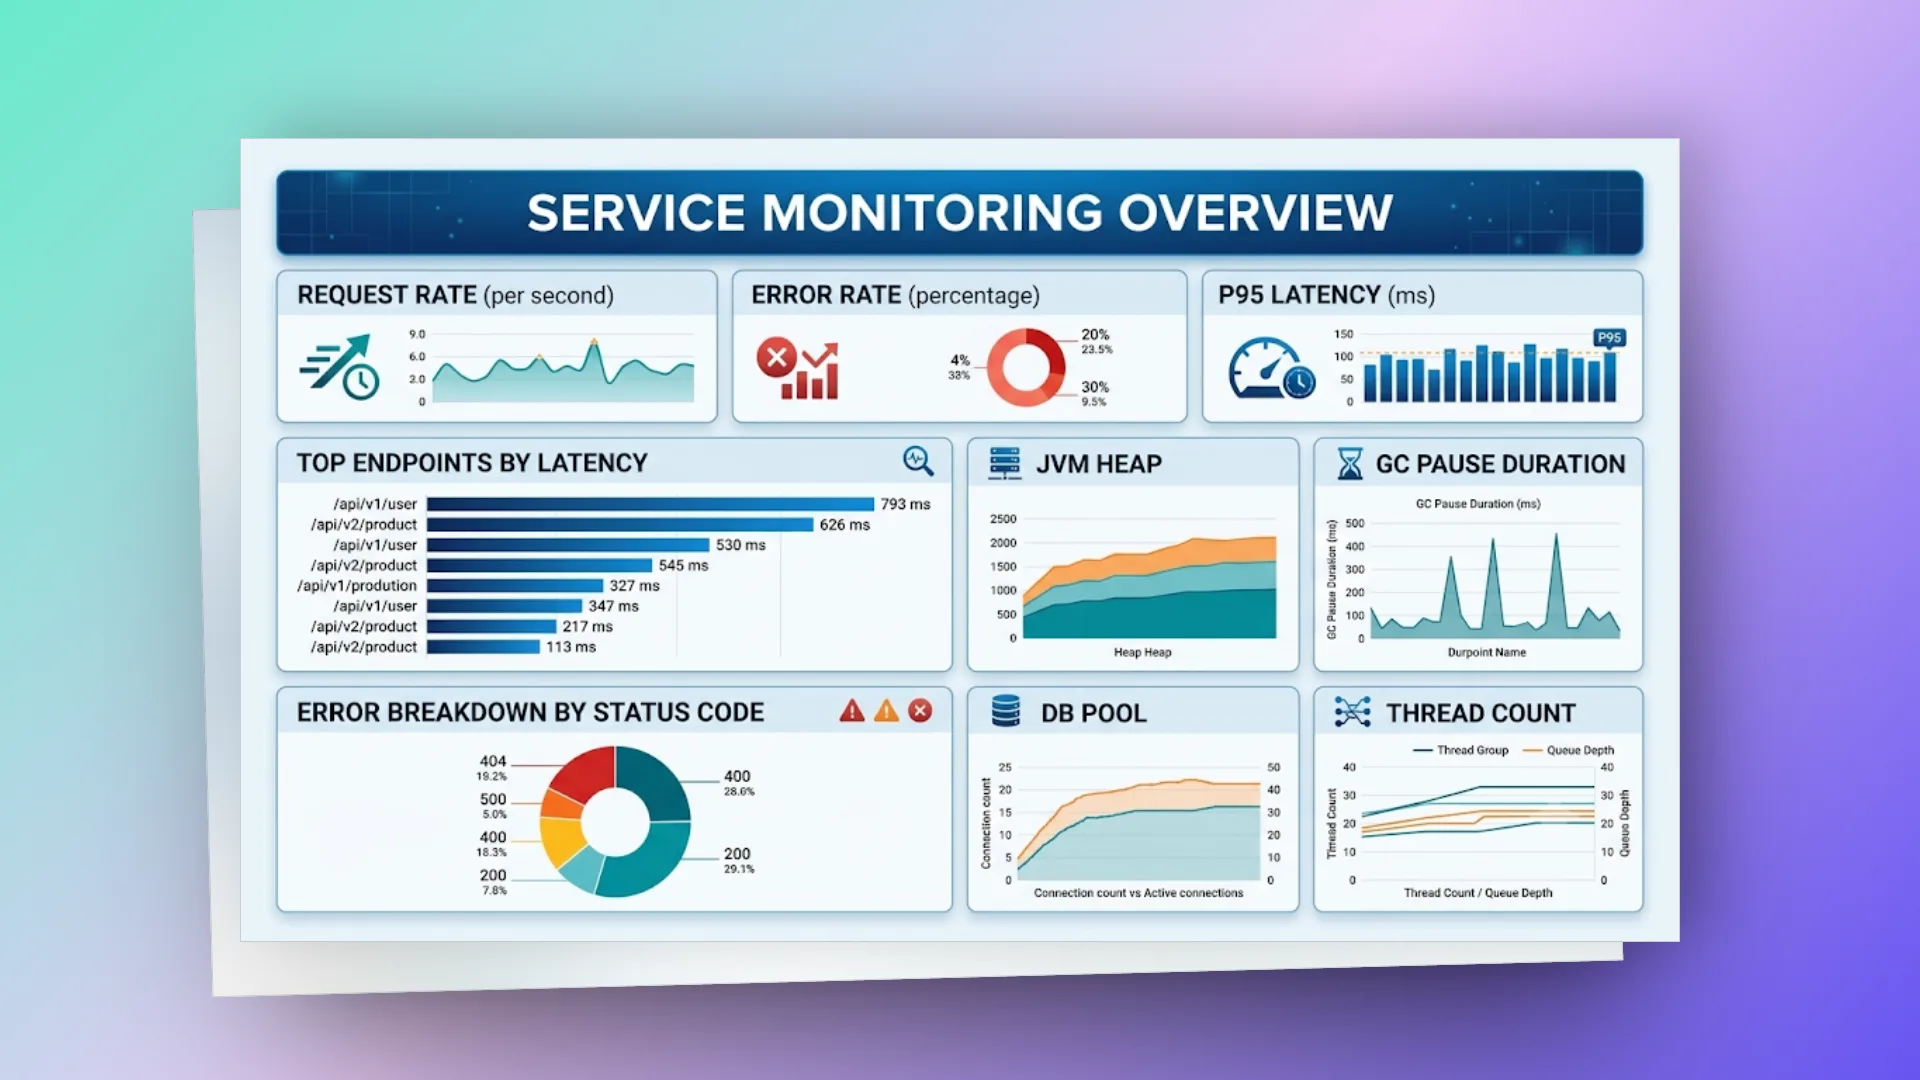
# red method (request-focused)
| Metric | Query | Purpose |
|---|---|---|
| Rate | sum(rate(http_server_requests_seconds_count[5m])) | Traffic volume |
| Errors | sum(rate(http_server_requests_seconds_count{status=~"5.."}[5m])) | Error detection |
| Duration | histogram_quantile(0.95, sum by (le) (rate(http_server_requests_seconds_bucket[5m]))) | Latency |
# use method (resource-focused)
| Resource | Utilization | Saturation | Errors |
|---|---|---|---|
| CPU | process_cpu_usage | Load average | — |
| Memory | jvm_memory_used / max | GC frequency | OOM events |
| DB Pool | active / max | pending > 0 | Connection timeouts |
| Threads | live_threads / max | Thread pool queue | Rejected tasks |
| Disk | disk_used / total | I/O wait | I/O errors |
# essential dashboard panels
# production debugging
# troubleshooting workflow
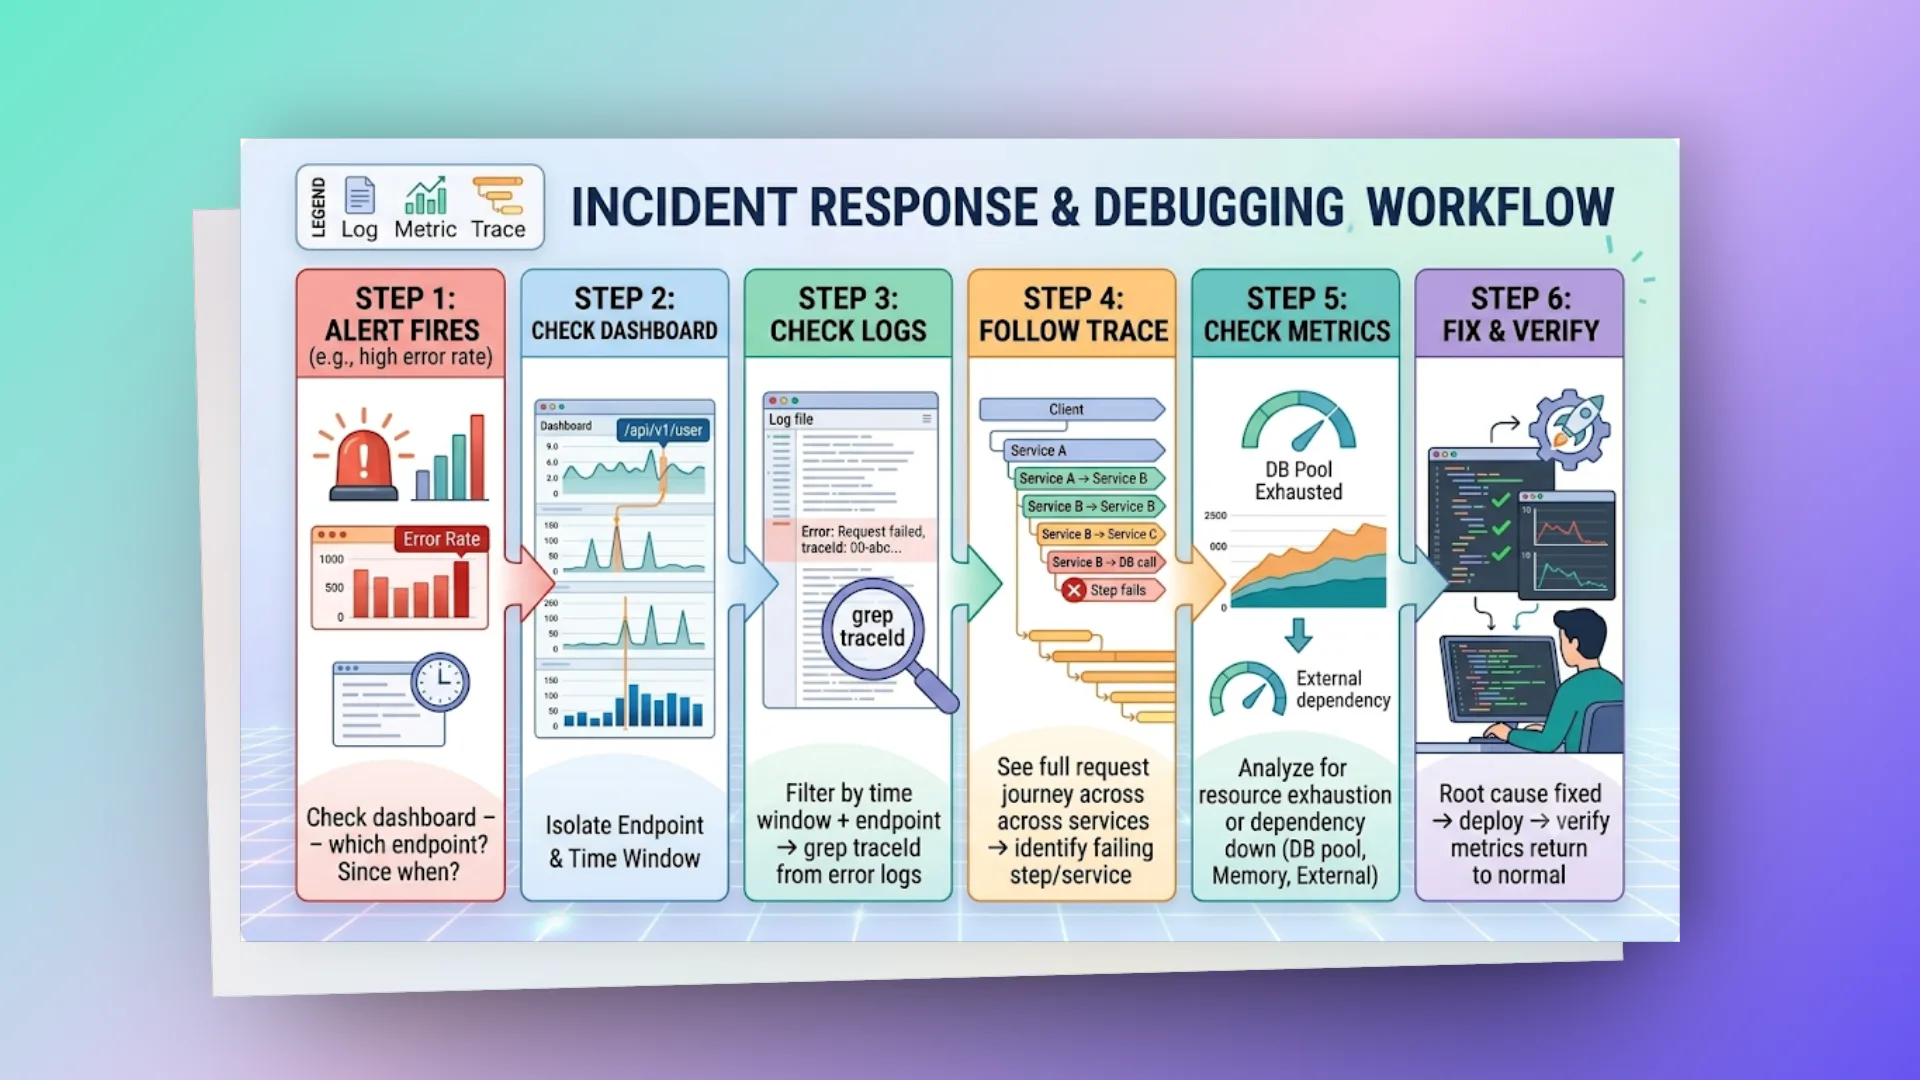
Các endpoint loggers, threaddump, heapdump dùng ở dưới không nằm trong danh sách exposure.include ở trên, muốn gọi được thì phải thêm vào. Nhớ chặn chúng sau auth hoặc chỉ mở trên management port nội bộ: heap dump chứa nguyên dữ liệu trong bộ nhớ, kể cả password và token.
# dynamic log level (runtime change)
# Change log level without restart via Actuator
curl -X POST http://service:8080/actuator/loggers/com.tungdadev \
 -H 'Content-Type: application/json' \
 -d '{"configuredLevel": "DEBUG"}'

# Revert
curl -X POST http://service:8080/actuator/loggers/com.tungdadev \
 -H 'Content-Type: application/json' \
 -d '{"configuredLevel": "INFO"}'
# thread dump (deadlock/hang detection)
# Via Actuator
curl http://service:8080/actuator/threaddump

# Look for:
# - BLOCKED threads (chờ lock; deadlock khi các thread chờ vòng tròn lẫn nhau,
#   jstack/jcmd Thread.print sẽ in "Found one Java-level deadlock")
# - WAITING on same lock (contention)
# - Many threads in same stack (bottleneck)
# heap dump (memory leak)
# Via Actuator
curl -o heapdump.hprof http://service:8080/actuator/heapdump

# Analyze with Eclipse MAT or VisualVM
# Look for:
# - Largest retained objects
# - Objects growing over time
# - Unclosed resources (connections, streams)
# performance baselines
# establish per service
Baseline metrics (measure during normal load):
- P50 latency: 15ms
- P95 latency: 45ms
- P99 latency: 120ms
- Error rate: < 0.1%
- Throughput: 500 req/s
- DB pool utilization: 30%
- Heap usage: 60%
- GC pause: < 50ms

Alert when:
- P95 > 2x baseline (45ms → alert at 90ms)
- Error rate > 50x baseline (0.1% → alert at 5%)
- Pool utilization > 80%
- Heap > 85%
# sli/slo framework
# service level indicators (sli)
Availability SLI = successful requests / total requests
Latency SLI = requests < threshold / total requests
Throughput SLI = requests served within capacity / total requests
# service level objectives (slo)
Đòi 100% Uptime thì vừa không thực tế vừa tốn kém. Các team giỏi đặt Service Level Objectives (SLO) thay vào đó.
| Service | Availability | Latency (P95) | Error Budget |
|---|---|---|---|
| API Gateway | 99.9% | < 200ms | 43 min/month downtime |
| Order Service | 99.95% | < 500ms | 21 min/month |
| Payment Service | 99.99% | < 1s | 4 min/month |
| Report Engine | 99.5% | < 30s | 3.6 hours/month |
# error budget policy
Error budget remaining > 50%: Ship freely, experiment
Error budget remaining 20-50%: Normal development, careful with risky changes
Error budget remaining < 20%: Focus on reliability, no risky deployments
Error budget exhausted: Freeze features, fix reliability issues only
# checklist: instrumenting a new service
- Log4j2 configured with structured pattern
- MDC populated in request filter (traceId, userId)
- Actuator endpoints exposed (health, prometheus, info)
- Custom business metrics added (counters, timers)
- Health indicators for external dependencies
- Tracing configured (sampling rate appropriate for env)
- Grafana dashboard created (RED + USE panels)
- Alerts configured (P1, P2 at minimum)
- Baseline metrics documented
- Runbook created for common alerts
Chỉ là những ghi chép cá nhân với hy vọng mang lại chút giá trị. Nếu thấy hữu ích, đừng ngại chia sẻ cho bạn bè & đồng nghiệp nhé!
Happy coding 😎 👍🏻 🚀 🔥.