jmeter
Tung Bui Thanh (TungDaDev)27 mins read

Trước khi mở JMeter, nên phân biệt rõ mình đang chạy loại test nào, vì mỗi loại có mục tiêu và cách đọc kết quả khác nhau:
| Loại test | Mục đích | Ví dụ |
|---|---|---|
| Load Test | Kiểm tra với tải bình thường/dự kiến | 500 concurrent users trong 10 phút |
| Stress Test | Tìm giới hạn chịu tải tối đa | Tăng dần từ 100 → 5000 users |
| Spike Test | Kiểm tra đột biến tải | 0 → 2000 users trong 10 giây |
| Soak/Endurance Test | Kiểm tra memory leak, resource drain | 200 users liên tục 24 giờ |
| Scalability Test | Đo khả năng mở rộng | So sánh 1 instance vs 3 instances |
# cài đặt & cấu hình
# cài đặt jmeter
# Download từ https://jmeter.apache.org/download_jmeter.cgi
# Giải nén và chạy
cd apache-jmeter-5.6.3/bin

# Windows
jmeter.bat

# Linux/Mac
./jmeter.sh
# cấu hình jvm cho jmeter (test lớn)
# File: bin/jmeter.bat hoặc bin/jmeter
# Tăng heap cho JMeter khi chạy test lớn (>1000 threads)
HEAP="-Xms2g -Xmx4g"
Mặc định script khởi động của JMeter 5.6.3 đặt -Xms1g -Xmx1g -XX:MaxMetaspaceSize=256m. Trên Linux/Mac không cần sửa file: script bin/jmeter đọc biến môi trường HEAP nếu có, nên chỉ cần export HEAP="-Xms2g -Xmx4g" trước khi chạy (khi đặt HEAP thì nhớ tự thêm -XX:MaxMetaspaceSize nếu cần). Trên Windows thì sửa dòng set HEAP=... trong bin\jmeter.bat, hoặc đặt biến HEAP tương tự.
# kiến trúc jmeter: các thành phần chính
Test Plan
├── Thread Group (mô phỏng virtual users)
│   ├── Sampler (HTTP Request, JDBC, etc.)
│   ├── Config Element (Header Manager, Cookie Manager, CSV Data)
│   ├── Pre-Processor (JSR223, User Parameters)
│   ├── Post-Processor (JSON Extractor, Regex Extractor)
│   ├── Assertion (Response Assertion, Duration Assertion)
│   └── Timer (Constant, Gaussian, Uniform Random)
├── Listener (View Results Tree, Summary Report, Aggregate Report)
└── Logic Controller (If, Loop, Transaction, Random Order)
# giải thích các thành phần
| Component | Chức năng | Khi nào dùng |
|---|---|---|
| Thread Group | Định nghĩa số user, ramp-up time, loop count | Luôn cần: entry point |
| HTTP Request | Gửi HTTP request đến API | Test REST API |
| Header Manager | Thêm headers (Authorization, Content-Type) | API cần auth token |
| CSV Data Set Config | Đọc test data từ file CSV | Parameterize requests |
| JSON Extractor | Trích xuất giá trị từ JSON response | Lấy token, ID cho request tiếp |
| Response Assertion | Kiểm tra response đúng mong đợi | Validate status code, body |
| Constant Timer | Delay giữa các request | Mô phỏng think time thực tế |
| Transaction Controller | Nhóm nhiều request thành 1 transaction | Đo thời gian một business flow |
# spring boot api mẫu để test
# controller
@RestController
@RequestMapping("/api/v1/products")
@RequiredArgsConstructor
public class ProductController {

   private final ProductService productService;

   @GetMapping
   public ResponseEntity<APIResponse<Page<ProductDTO>>> list(
           @RequestParam(defaultValue = "0") int page,
           @RequestParam(defaultValue = "20") int size,
           @RequestParam(required = false) String keyword) {
       Page<ProductDTO> result = productService.search(keyword, PageRequest.of(page, size));
       return ResponseEntity.ok(APIResponse.success(result));
   }

   @GetMapping("/{id}")
   public ResponseEntity<APIResponse<ProductDTO>> getById(@PathVariable UUID id) {
       return ResponseEntity.ok(APIResponse.success(productService.getById(id)));
   }

   @PostMapping
   public ResponseEntity<APIResponse<ProductDTO>> create(
           @Valid @RequestBody CreateProductRequest request) {
       ProductDTO created = productService.create(request);
       return ResponseEntity.status(HttpStatus.CREATED).body(APIResponse.success(created));
   }

   @PutMapping("/{id}")
   public ResponseEntity<APIResponse<ProductDTO>> update(
           @PathVariable UUID id,
           @Valid @RequestBody UpdateProductRequest request) {
       return ResponseEntity.ok(APIResponse.success(productService.update(id, request)));
   }

   @DeleteMapping("/{id}")
   @ResponseStatus(HttpStatus.NO_CONTENT)
   public void delete(@PathVariable UUID id) {
       productService.delete(id);
   }
}
# security config (endpoint cần bearer token)
@Configuration
@EnableWebSecurity
public class SecurityConfig {

   @Bean
   public SecurityFilterChain filterChain(HttpSecurity http) throws Exception {
       return http
           .csrf(AbstractHttpConfigurer::disable)
           .sessionManagement(s -> s.sessionCreationPolicy(SessionCreationPolicy.STATELESS))
           .oauth2ResourceServer(oauth -> oauth.jwt(Customizer.withDefaults()))
           .authorizeHttpRequests(auth -> auth
               .requestMatchers("/actuator/**").permitAll()
               .anyRequest().authenticated())
           .build();
   }
}
# thiết kế test plan trong jmeter
# test plan cơ bản: get api (không auth)
Test Plan: Product API Load Test
└── Thread Group
   ├── Number of Threads: 100
   ├── Ramp-Up Period: 30 seconds
   ├── Loop Count: 10
   │
   ├── HTTP Request Defaults
   │   ├── Server: localhost
   │   ├── Port: 8093
   │   └── Protocol: http
   │
   ├── HTTP Request: GET /api/v1/products
   │   ├── Method: GET
   │   ├── Path: /api/v1/products
   │   └── Parameters: page=0, size=20
   │
   ├── Response Assertion
   │   └── Response Code: 200
   │
   ├── Constant Timer
   │   └── Thread Delay: 1000ms (think time)
   │
   └── Listeners
       ├── Summary Report
       ├── Aggregate Report
       └── Response Time Graph
# test plan với authentication (oauth2/jwt)
Khi Spring Boot dùng OAuth2 Resource Server thì mỗi virtual user phải lấy token trước, sau đó gửi kèm header Authorization: Bearer ... ở mọi request.
Test Plan: Authenticated API Load Test
└── Thread Group (100 users, 60s ramp-up, loop=20)
   │
   ├── [Once Only Controller] Lay token 1 lan moi thread
   │   ├── HTTP Request: POST /realms/csp/protocol/openid-connect/token
   │   │   ├── Server: keycloak.local
   │   │   ├── Port: 8080
   │   │   ├── Method: POST
   │   │   ├── Content-Type: application/x-www-form-urlencoded
   │   │   └── Body Data:
   │   │       grant_type=client_credentials
   │   │       &client_id=csp-service
   │   │       &client_secret=${CLIENT_SECRET}
   │   │
   │   └── JSON Extractor
   │       ├── Variable Name: access_token
   │       └── JSON Path: $.access_token
   │
   ├── HTTP Header Manager
   │   ├── Authorization: Bearer ${access_token}
   │   └── Content-Type: application/json
   │
   ├── [Transaction Controller: Create Product]
   │   └── HTTP Request: POST /api/v1/products
   │       ├── Method: POST
   │       ├── Body Data:
   │       │   {
   │       │     "name": "Product-${__UUID()}",
   │       │     "code": "PRD-${__counter(,)}",
   │       │     "price": ${__Random(100,9999,)}
   │       │   }
   │       │
   │       └── JSON Extractor (extract product ID, dat CON cua request POST)
   │           ├── Variable Name: product_id
   │           └── JSON Path: $.data.id
   │
   ├── [Transaction Controller: Get Product by ID]
   │   └── HTTP Request: GET /api/v1/products/${product_id}
   │
   ├── [Transaction Controller: Update Product]
   │   └── HTTP Request: PUT /api/v1/products/${product_id}
   │       └── Body Data:
   │           {
   │             "name": "Updated-${__UUID()}",
   │             "price": ${__Random(200,19999,)}
   │           }
   │
   ├── [Transaction Controller: Delete Product]
   │   └── HTTP Request: DELETE /api/v1/products/${product_id}
   │
   ├── Constant Timer: 500ms
   │
   └── Listeners
       ├── Aggregate Report
       └── View Results Tree (debug only, disable in real test)
Vài chỗ trong cây trên dễ làm sai:
- Scope của Post-Processor. Trong JMeter, Post-Processor (JSON Extractor...) chạy sau mọi sampler nằm cùng cấp hoặc bên dưới nó. Nếu đặt JSON Extractor lấy
product_idở cấp Thread Group, nó sẽ chạy cả sau GET, PUT, DELETE. Request DELETE trả 204 không có body, extractor không tìm thấy$.data.idvà ghi đèproduct_idbằng giá trị mặc định. Vì vậy extractor phải là con trực tiếp của request POST. - Đường dẫn token của Keycloak. Từ Keycloak 17 (bản Quarkus), prefix
/authbị bỏ, endpoint là/realms/<realm>/protocol/openid-connect/token. Bản cũ (WildFly) hoặc bản cấu hìnhhttp-relative-path=/authmới cần/auth/realms/.... - Token hết hạn. Once Only Controller chỉ lấy token một lần cho mỗi thread. Test chạy lâu hơn thời gian sống của access token (Keycloak mặc định 5 phút) thì nửa sau toàn 401. Với soak test, cần thêm logic refresh token (If Controller kiểm tra thời điểm hết hạn) hoặc tăng lifetime của client dùng để test.
# test plan với csv data (nhiều users khác nhau)
File users.csv:
username,password
user001,Pass@123
user002,Pass@123
user003,Pass@123
...
user100,Pass@123
Test Plan
└── Thread Group
├── CSV Data Set Config
│ ├── Filename: users.csv
│ ├── Variable Names: username,password
│ ├── Delimiter: ,
│ ├── Recycle on EOF: True
│ └── Sharing mode: All threads
│
├── HTTP Request: Login
│ └── Body: grant_type=password&username=${username}&password=${password}
│
└── ... (rest of test)
Với Sharing mode: All threads, mỗi thread lấy dòng kế tiếp trong file, nên 100 thread sẽ dùng 100 user khác nhau. Lưu ý grant_type=password (Resource Owner Password Credentials) đã bị loại khỏi OAuth 2.1 và bị khuyến cáo không dùng trong OAuth 2.0 Security BCP; ở đây nó chỉ tiện cho môi trường test. Client dùng grant này nên là client riêng cho performance test, không bật trên production.
# chạy jmeter: gui vs cli
# gui mode (chỉ dùng để thiết kế & debug)
# Mở GUI
./bin/jmeter        # Windows: bin\jmeter.bat
# Tạo test plan → Save as .jmx file
# KHÔNG chạy test thực sự ở GUI — tốn resource, kết quả không chính xác
# cli mode (non-gui, dùng cho test thực tế)
# Chạy test từ command line
jmeter -n -t test-plan.jmx -l results.jtl -e -o report-output/

# Giải thích:
# -n : non-GUI mode
# -t : test plan file (.jmx)
# -l : log results file (.jtl)
# -e : generate HTML report sau khi test xong
# -o : output folder cho HTML report (phải rỗng hoặc chưa tồn tại)

# Với custom properties
jmeter -n -t test-plan.jmx -l results.jtl \
 -Jthreads=200 \
 -Jrampup=60 \
 -Jduration=300 \
 -Jhost=api.staging.tungdadev.com \
 -Jport=443
# sử dụng properties trong test plan
Trong Thread Group:
- Number of Threads:
${__P(threads,100)}, mặc định 100, override bằng-Jthreads=200 - Ramp-Up:
${__P(rampup,30)} - Duration:
${__P(duration,180)}
Duration chỉ có tác dụng khi tick ô Specify Thread lifetime và đặt Loop Count là Infinite. Nếu vẫn để loop count cố định, thread nào chạy hết số vòng sẽ dừng sớm, còn thread nào chưa hết sẽ bị cắt khi hết duration.
__P đọc JMeter property, nên giá trị truyền qua -J trên command line. Biến môi trường của shell thì không đọc được trực tiếp, phải dùng -Jthreads=$THREADS như ví dụ CI ở cuối bài.
# jmeter functions hữu ích
| Function | Mô tả | Ví dụ |
|---|---|---|
${__UUID()} | Generate UUID ngẫu nhiên | Tạo unique name |
${__Random(1,1000,)} | Số ngẫu nhiên trong range | Random price |
${__counter(,)} | Bộ đếm tăng dần | Sequential ID |
${__time(yyyy-MM-dd,)} | Timestamp hiện tại | Created date |
${__threadNum} | Số thứ tự thread hiện tại | Debugging |
${__P(prop,default)} | Đọc property | Parameterize từ CLI |
${__groovy(code)} | Chạy Groovy inline | Complex logic |
${__RandomString(10,abcdef,)} | Chuỗi ngẫu nhiên | Random code |
${__CSVRead(file,column)} | Đọc CSV | Test data |
# đọc kết quả: các metrics quan trọng
# aggregate report
| Metric | Ý nghĩa | Ngưỡng chấp nhận (ví dụ) |
|---|---|---|
| Samples | Tổng số request đã gửi | : |
| Average (ms) | Thời gian phản hồi trung bình | < 500ms cho API thường |
| Median (ms) | P50: 50% request nhanh hơn giá trị này | < 300ms |
| 90% Line (ms) | P90: 90% request nhanh hơn | < 1000ms |
| 95% Line (ms) | P95: quan trọng cho SLA | < 1500ms |
| 99% Line (ms) | P99: worst case trừ outliers | < 3000ms |
| Min/Max (ms) | Response time nhỏ nhất/lớn nhất | : |
| Error % | Tỷ lệ lỗi | < 1% (load test), < 5% (stress) |
| Throughput (req/s) | Số request server xử lý mỗi giây | Phụ thuộc yêu cầu |
| KB/sec | Bandwidth sử dụng | : |
# phân tích kết quả
Ví dụ kết quả Aggregate Report (số liệu minh hoạ):

Label          | Samples | Avg  | P90  | P95  | P99  | Error% | Throughput
---------------|---------|------|------|------|------|--------|----------
GET /products  | 10000   | 125  | 250  | 380  | 890  | 0.02%  | 312.5/s
POST /products | 5000    | 340  | 680  | 920  | 1850 | 0.12%  | 156.2/s
GET /products/{id} | 5000 | 85  | 150  | 210  | 450  | 0.0%   | 156.2/s

Đánh giá:
✅ GET /products: P95 < 500ms → đạt
✅ GET /products/{id}: rất nhanh, có thể đã cache
⚠️  POST /products: P99 = 1850ms → cần investigate (DB write? validation heavy?)
✅ Error rate: < 1% tổng thể → acceptable
# distributed testing: chạy jmeter phân tán
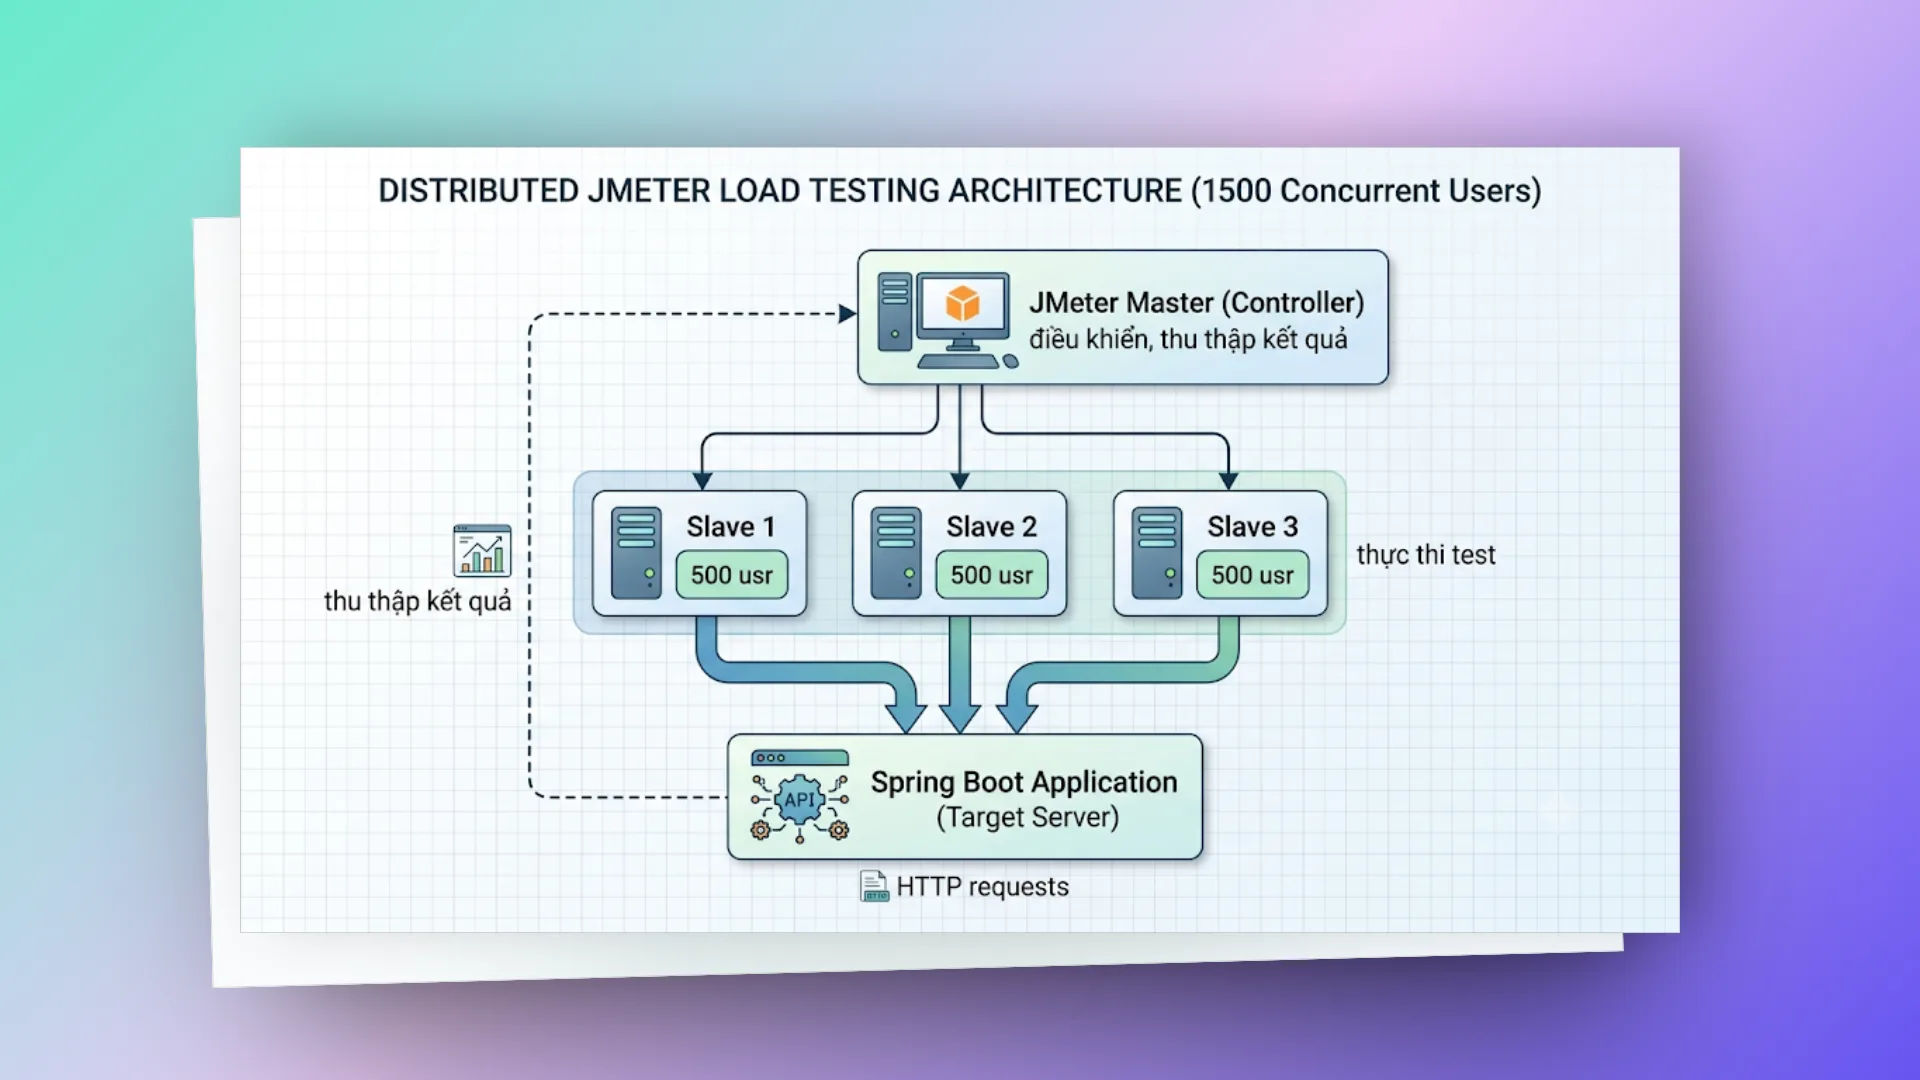
Muốn mô phỏng vài nghìn user trở lên thì một máy JMeter thường không đủ CPU, RAM hoặc băng thông mạng. Lúc đó dùng distributed mode: một máy master điều khiển, nhiều máy slave (JMeter gọi là server) sinh tải thật.
# kiến trúc
# cấu hình
# Trên mỗi Slave machine — chạy JMeter server
jmeter-server -Djava.rmi.server.hostname=192.168.1.101

# Trên Master — file jmeter.properties
remote_hosts=192.168.1.101,192.168.1.102,192.168.1.103

# Chạy distributed test từ Master
jmeter -n -t test-plan.jmx -l results.jtl -R 192.168.1.101,192.168.1.102,192.168.1.103
# lưu ý quan trọng
- Tất cả machines phải cùng version JMeter
- CSV data files phải có trên mỗi slave (hoặc dùng absolute path chung)
- Firewall phải mở port RMI (default 1099) và port range cho data transfer
- Master chỉ điều khiển, không chạy test (trừ khi thêm
localhostvào remote_hosts) - Từ JMeter 4.0, kênh RMI mặc định dùng SSL. Phải tạo keystore bằng
bin/create-rmi-keystore.shrồi copy filermi_keystore.jkssang mọi máy, hoặc tắt SSL bằngserver.rmi.ssl.disable=true(chỉ nên làm trong mạng nội bộ tin cậy). Không làm bước này thìjmeter-serverkhông khởi động được. - Mỗi slave chạy toàn bộ test plan. 3 slave với Thread Group 100 threads nghĩa là tổng 300 user, không phải 100 chia ba.
- Port data mặc định là ngẫu nhiên, khó mở firewall. Nên cố định bằng
server.rmi.localport(trên slave) vàclient.rmi.localport(trên master).
# tối ưu spring boot để chịu tải tốt hơn
Khi JMeter đã chỉ ra chỗ nghẽn thì mới tuning. Đừng chỉnh mò khi chưa có số đo. Dưới đây là mấy chỗ hay phải đụng tới trong Spring Boot.
# connection pool (HikariCP)
# application.yml
spring:
  datasource:
    hikari:
      maximum-pool-size: 30 # Tăng theo số concurrent request
      minimum-idle: 10
      connection-timeout: 20000 # 20s
      idle-timeout: 300000 # 5 phút
      max-lifetime: 1200000 # 20 phút
      leak-detection-threshold: 60000 # Log warning nếu connection giữ > 60s
Comment "tăng theo số concurrent request" dễ gây hiểu lầm. Pool lớn hơn không có nghĩa là nhanh hơn: database chỉ thực sự chạy song song được cỡ số core (cộng thêm phần chờ disk). Tài liệu "About Pool Sizing" của HikariCP gợi ý điểm xuất phát connections = (core_count * 2) + effective_spindle_count rồi đo để chỉnh. Nếu 200 request đồng thời mà pool chỉ có 30 thì 170 request còn lại xếp hàng chờ connection, chuyện đó bình thường. Chỉ khi thấy hikaricp_connections_pending cao kéo dài trong lúc CPU database vẫn rảnh thì mới nên tăng.
# tomcat thread pool
server:
  tomcat:
    threads:
      max: 200 # Max worker threads (default: 200)
      min-spare: 20 # Min idle threads
    max-connections: 8192
    accept-count: 100 # Queue size khi tất cả threads bận
    connection-timeout: 20000
Các giá trị mặc định của Spring Boot là threads.max=200, min-spare=10, max-connections=8192, accept-count=100. Khi cả 200 thread đều bận, connection mới vẫn được Tomcat nhận (tới 8192) và chờ thread rảnh. Vượt quá đó thì vào backlog của OS (accept-count), đầy nốt thì client bị từ chối hoặc timeout ở tầng TCP. Từ Spring Boot 3.2 trên Java 21, có thể bật spring.threads.virtual.enabled=true để Tomcat dùng virtual thread cho mỗi request, lúc đó threads.max gần như không còn là giới hạn, nút thắt chuyển sang connection pool của database.
# redis cache (giảm db hits)
@Service
@RequiredArgsConstructor
public class ProductService {

   private final ProductRepository repo;
   private final RedisTemplate<String, ProductDTO> redisTemplate;

   @Cacheable(value = "products", key = "#id", unless = "#result == null")
   public ProductDTO getById(UUID id) {
       return repo.findById(id)
           .map(this::toDTO)
           .orElseThrow(() -> new EntityNotFoundException("Product not found: " + id));
   }

   @CacheEvict(value = "products", key = "#id")
   public ProductDTO update(UUID id, UpdateProductRequest request) {
       // ... update logic
   }
}
Ở đây update dùng @CacheEvict nên lần GET tiếp theo sẽ đọc lại từ DB. Muốn ghi luôn giá trị mới vào cache thì dùng @CachePut(value = "products", key = "#id"). Annotation cache chỉ có tác dụng khi đã bật @EnableCaching và có cache provider (ví dụ spring-boot-starter-data-redis); field redisTemplate trong ví dụ chỉ cần khi bạn thao tác Redis thủ công.
# async processing
@Configuration
@EnableAsync
public class AsyncConfig {

   @Bean("taskExecutor")
   public Executor taskExecutor() {
       ThreadPoolTaskExecutor executor = new ThreadPoolTaskExecutor();
       executor.setCorePoolSize(10);
       executor.setMaxPoolSize(30);
       executor.setQueueCapacity(500);
       executor.setThreadNamePrefix("async-");
       executor.setRejectedExecutionHandler(new ThreadPoolExecutor.CallerRunsPolicy());
       executor.initialize();
       return executor;
   }
}

// Non-critical work (audit log, notification) chạy async
@Async("taskExecutor")
public void logActivity(ActivityEvent event) {
   activityRepository.save(event);
}
@Async chạy qua proxy, nên gọi logActivity() từ một method khác trong cùng class sẽ không async. CallerRunsPolicy nghĩa là khi queue 500 đã đầy, thread của request phải tự chạy task, nên latency của request tăng lên. Đây là cơ chế tự hãm (backpressure) có chủ đích chứ không phải lỗi, nhưng nhìn kết quả JMeter cần nhớ điều này.
# jvm tuning
# Cho production với Spring Boot
JAVA_OPTS="-Xms2g -Xmx2g \
 -XX:+UseG1GC \
 -XX:MaxGCPauseMillis=200 \
 -XX:+UseStringDeduplication \
 -XX:+OptimizeStringConcat \
 -Djava.security.egd=file:/dev/./urandom"
Xem kỹ thì phần lớn các flag trên đã là mặc định trên JDK hiện đại. G1 là GC mặc định từ JDK 9 (trên máy đủ 2 CPU và 2GB RAM), MaxGCPauseMillis mặc định đã là 200, OptimizeStringConcat bật sẵn. Mẹo java.security.egd=file:/dev/./urandom là để chữa chuyện khởi động chậm vì chờ entropy trên JDK 8 cũ, JDK 11+ gần như không cần. Flag đáng giữ là -Xms bằng -Xmx (tránh heap co giãn trong lúc test) và UseStringDeduplication nếu app giữ nhiều String trùng. Chạy trong container thì nên dùng -XX:MaxRAMPercentage=75 thay vì số cứng.
# monitoring spring boot trong khi load test
# spring boot actuator + prometheus + grafana
# application.yml
management:
  endpoints:
    web:
      exposure:
        include: health,prometheus,metrics
  prometheus:
    metrics:
      export:
        enabled: true
  metrics:
    tags:
      application: ${spring.application.name}
Cần thêm dependency micrometer-registry-prometheus. Từ Spring Boot 3.0, property management.metrics.export.prometheus.enabled đã đổi thành management.prometheus.metrics.export.enabled như trên (mặc định đã là true khi có dependency).
# metrics cần theo dõi song song với jmeter
| Metric | Prometheus Query | Alert khi |
|---|---|---|
| HTTP request duration | http_server_requests_seconds{quantile="0.95"} | > 2s |
| Active threads | tomcat_threads_busy_threads | > 80% max |
| DB connection pool | hikaricp_connections_active | > 80% max pool |
| JVM Heap | jvm_memory_used_bytes{area="heap"} | > 80% max |
| GC pause | jvm_gc_pause_seconds_max | > 500ms |
| Error rate | http_server_requests_seconds_count{status=~"5.."} | > 1% |
| Queue depth (RabbitMQ) | rabbitmq_queue_messages | Tăng liên tục |
Bảng trên cần đọc kèm vài lưu ý. Series http_server_requests_seconds{quantile="0.95"} chỉ có khi bạn bật management.metrics.distribution.percentiles.http.server.requests=0.95, và percentile kiểu này tính riêng trên từng instance, không cộng gộp được. Chạy nhiều instance thì nên bật percentiles-histogram rồi dùng histogram_quantile(0.95, sum by (le, uri) (rate(http_server_requests_seconds_bucket[1m]))). Dòng error rate thì _count là counter tăng dần, muốn so với 1% phải lấy rate của request 5xx chia cho rate của tổng request. Metric tomcat_threads_busy_threads chỉ xuất hiện khi bật server.tomcat.mbeanregistry.enabled=true.
# kết hợp jmeter + grafana
JMeter có sẵn Backend Listener để đẩy metric real-time lên InfluxDB, rồi Grafana đọc từ đó để vẽ:
# Thêm Backend Listener trong JMeter:
# Type: org.apache.jmeter.visualizers.backend.influxdb.InfluxdbBackendListenerClient
# influxdbUrl: http://influxdb:8086/write?db=jmeter
# application: csp-product-api
# measurement: jmeter
URL trên là kiểu InfluxDB 1.x. Với InfluxDB 2.x, dùng endpoint /api/v2/write?org=...&bucket=... và thêm tham số influxdbToken. Dashboard Grafana sẽ hiển thị:
- Response time (avg, P90, P95, P99) theo thời gian
- Throughput (req/s) theo thời gian
- Error rate theo thời gian
- Active threads theo thời gian
# kịch bản test thực tế: csp api
# scenario 1: load test cho product search api
Mục tiêu: Xác nhận API search product chịu được 500 concurrent users

Thread Group:
- Threads: 500
- Ramp-up: 120s (mỗi giây thêm ~4 users)
- Duration: 600s (10 phút)

Kịch bản mỗi user:
1. Login lấy token (Once Only)
2. Loop:
  a. GET /api/v1/products?keyword=${random_keyword}&page=0&size=20
  b. Think time: 2-5s (Gaussian Random Timer)
  c. GET /api/v1/products/${random_id}
  d. Think time: 1-3s

Assertions:
- Response code = 200
- Response time < 2000ms
- Body contains "data"

Pass criteria:
- P95 response time < 1000ms
- Error rate < 1%
- Throughput > 150 req/s
Con số throughput phải tính từ think time chứ không đặt bừa. Theo định luật Little, throughput ≈ số user / (thời gian một vòng). Mỗi vòng ở đây có 2 request và trung bình khoảng 3.5s + 2s = 5.5s think time, cộng thời gian phản hồi. Vậy 500 user sinh tối đa khoảng 500 × 2 / 5.5 ≈ 180 req/s, có đặt tiêu chí "> 200 req/s" thì test không bao giờ đạt dù server khoẻ cỡ nào. Hiểu ngược lại, nếu throughput đo được thấp hơn nhiều so với con số này thì server đang làm chậm vòng lặp, response time đang tăng.
# scenario 2: stress test: tìm breaking point
Mục tiêu: Tìm số users tối đa trước khi error rate > 5%

Thread Group (Stepping Thread Group plugin):
- Start threads: 50
- Add 50 threads every 60 seconds (moi bac giu tai ~60s)
- Max threads: 2000
- Hold load for 300s khi da dat max

Quan sát:
- Tại bước nào error rate bắt đầu > 1%?
- Tại bước nào response time P95 > 3s?
- Tại bước nào throughput bắt đầu giảm (saturation point)?

Ví dụ kết quả:
- 50-400 users: ổn định, P95 < 500ms
- 400-600 users: P95 tăng lên 800ms-1200ms
- 600-800 users: error rate bắt đầu 2-3%, P95 = 2000ms
- > 800 users: error rate > 5% → BREAKING POINT ≈ 700-800 users
# scenario 3: soak test: phát hiện memory leak
Mục tiêu: Chạy liên tục 4 giờ, kiểm tra memory leak

Thread Group:
- Threads: 100 (moderate load)
- Ramp-up: 60s
- Duration: 14400s (4 giờ)

Quan sát theo thời gian:
- JVM Heap usage: tăng dần không giải phóng? → Memory leak
- Response time: tăng dần? → Resource exhaustion
- GC frequency: tăng? → Heap pressure
- DB connection: tăng dần? → Connection leak
- Thread count: tăng dần? → Thread leak

Red flags:
⚠️ Heap tăng liên tục qua mỗi giờ (sawtooth pattern bình thường, upward trend = leak)
⚠️ Full GC ngày càng thường xuyên
⚠️ Response time tăng 50%+ sau 2 giờ so với ban đầu
# jmeter plugins hữu ích
# cài đặt plugin manager
# Download từ https://jmeter-plugins.org/install/Install/
# Copy jmeter-plugins-manager.jar vào lib/ext/
# Restart JMeter → Menu Options → Plugins Manager
# plugins nên cài
| Plugin | Chức năng |
|---|---|
| Custom Thread Groups | Stepping Thread Group, Ultimate Thread Group (ramp pattern phức tạp) |
| 3 Basic Graphs | Response Time Over Time, Active Threads, Transactions Per Second |
| Throughput Shaping Timer | Kiểm soát chính xác throughput theo thời gian |
| JSON/YAML Plugins | Hỗ trợ JSON Path Assertion, YAML processing |
| Parallel Controller | Chạy nhiều request song song trong 1 thread |
| Inter-Thread Communication | Chia sẻ data giữa thread groups |
| InfluxDB Writer | Push metrics real-time lên InfluxDB/Grafana |
# ultimate thread group: load pattern phức tạp
Ví dụ: Mô phỏng traffic thực tế trong ngày

Row 1: Threads=100, InitialDelay=0,   Startup=60, Hold=300, Shutdown=30
Row 2: Threads=200, InitialDelay=120, Startup=60, Hold=240, Shutdown=30  (peak)
Row 3: Threads=50,  InitialDelay=360, Startup=30, Hold=120, Shutdown=60  (off-peak)

Timeline:
0-60s:    Ramp 0→100
60-120s:  Hold 100
120-180s: Ramp 100→300 (thêm 200)
180-360s: Hold 300
360-390s: Row 1 tắt dần, Row 3 lên dần → ~250
390-420s: Hold ~250
420-450s: Row 2 tắt dần → 50
450-510s: Hold 50
510-570s: 50→0
Mỗi dòng của Ultimate Thread Group có 5 cột: Start Threads Count, Initial Delay, Startup Time, Hold Load For, Shutdown Time. Các dòng chạy độc lập và chồng lên nhau theo thời gian, nên tổng số thread tại một thời điểm là tổng các dòng đang hoạt động.
# scripting trong jmeter: jsr223 (groovy)
# pre-processor: generate complex request body
// JSR223 PreProcessor (Groovy)
import groovy.json.JsonOutput
import java.time.LocalDateTime
import java.time.format.DateTimeFormatter

def now = LocalDateTime.now().format(DateTimeFormatter.ISO_DATE_TIME)
def requestBody = [
   name: "Product-" + UUID.randomUUID().toString().take(8),
   code: "PRD-" + ctx.getThreadNum() + "-" + System.currentTimeMillis(),
   price: new Random().nextInt(9000) + 1000,
   category: ["ELECTRONICS", "CLOTHING", "FOOD", "BOOKS"][new Random().nextInt(4)],
   metadata: [
       createdAt: now,
       source: "jmeter-load-test",
       batchId: vars.get("BATCH_ID") ?: "batch-001"
   ]
]

vars.put("requestBody", JsonOutput.toJson(requestBody))
Hai chỗ cần để ý khi viết script JSR223. Thứ nhất, __threadNum là JMeter function chứ không phải biến, nên vars.get('__threadNum') luôn trả null; trong Groovy lấy số thứ tự thread bằng ctx.getThreadNum(). Thứ hai, JMeter thay thế cú pháp ${...} trong nội dung script trước khi Groovy chạy. Viết ${myVar} trong script vừa dễ nhầm với GString của Groovy, vừa làm hỏng cache compile của script. Cách an toàn là đọc biến bằng vars.get("myVar") và ghép chuỗi thường. Sampler HTTP sau đó dùng ${requestBody} làm Body Data.
# post-processor: extract và validate response
// JSR223 PostProcessor (Groovy)
import groovy.json.JsonSlurper

def response = new JsonSlurper().parseText(prev.getResponseDataAsString())

if (response.data?.id) {
   vars.put("created_product_id", response.data.id.toString())
   log.info("Created product: ${response.data.id}")
} else {
   log.error("Failed to create product. Response: ${prev.getResponseDataAsString()}")
   prev.setSuccessful(false)
   prev.setResponseMessage("Product creation failed - no ID returned")
}

// Lưu metrics custom
def responseTime = prev.getTime()
if (responseTime > 2000) {
   log.warn("SLOW REQUEST: ${prev.getSampleLabel()} took ${responseTime}ms")
}
# assertion: custom business logic validation
// JSR223 Assertion (Groovy)
import groovy.json.JsonSlurper

def response = new JsonSlurper().parseText(prev.getResponseDataAsString())

// Validate business rules
if (response.data?.price != null && response.data.price <= 0) {
   AssertionResult.setFailure(true)
   AssertionResult.setFailureMessage("Product price must be positive, got: ${response.data.price}")
}

if (response.data?.name?.length() > 255) {
   AssertionResult.setFailure(true)
   AssertionResult.setFailureMessage("Product name exceeds 255 chars")
}
# ci/cd integration: tự động hóa load test
# gitlab ci pipeline
# .gitlab-ci.yml
load-test:
  stage: performance
  image:
    name: alpine/jmeter:5.6.3
    entrypoint: ['']
  variables:
    TARGET_HOST: 'api.staging.internal'
    TARGET_PORT: '443'
    THREADS: '200'
    DURATION: '300'
  script:
    - apk add --no-cache python3
    - mkdir -p results
    - jmeter -n
      -t tests/load-test-plan.jmx
      -l results/results.jtl
      -e -o results/report/
      -Jhost=${TARGET_HOST}
      -Jport=${TARGET_PORT}
      -Jthreads=${THREADS}
      -Jduration=${DURATION}
    # Fail pipeline nếu error rate > 2% hoặc P95 > 2000ms
    - python3 scripts/check-results.py results/results.jtl
      --max-error-rate 2
      --max-p95 2000
  artifacts:
    paths:
      - results/report/
    when: always
  rules:
    - if: $CI_PIPELINE_SOURCE == "schedule" # Chạy theo schedule
    - if: $CI_COMMIT_BRANCH == "main"
      when: manual
# script kiểm tra kết quả tự động
# scripts/check-results.py
import csv
import math
import sys
import argparse

def analyze_results(jtl_file, max_error_rate, max_p95):
   errors = 0
   total = 0
   response_times = []

   with open(jtl_file, 'r') as f:
       reader = csv.DictReader(f)
       for row in reader:
           total += 1
           if row['success'] == 'false':
               errors += 1
           response_times.append(int(row['elapsed']))

   error_rate = (errors / total) * 100 if total > 0 else 0
   response_times.sort()
   # Nearest-rank: phần tử thứ ceil(0.95 * n), index bắt đầu từ 0
   p95_index = max(0, math.ceil(len(response_times) * 0.95) - 1)
   p95 = response_times[p95_index] if response_times else 0

   print(f"Total requests: {total}")
   print(f"Error rate: {error_rate:.2f}%")
   print(f"P95 response time: {p95}ms")

   if error_rate > max_error_rate:
       print(f"FAIL: Error rate {error_rate:.2f}% exceeds threshold {max_error_rate}%")
       sys.exit(1)
   if p95 > max_p95:
       print(f"FAIL: P95 {p95}ms exceeds threshold {max_p95}ms")
       sys.exit(1)

   print("PASS: All thresholds met")

if __name__ == "__main__":
   parser = argparse.ArgumentParser()
   parser.add_argument("jtl_file")
   parser.add_argument("--max-error-rate", type=float, default=2.0)
   parser.add_argument("--max-p95", type=int, default=2000)
   args = parser.parse_args()
   analyze_results(args.jtl_file, args.max_error_rate, args.max_p95)
Script này giả định file .jtl ở dạng CSV có dòng header, đúng với cấu hình mặc định của JMeter (jmeter.save.saveservice.output_format=csv). Nếu team đổi sang XML thì phải sửa phần đọc file. Image alpine/jmeter không có sẵn Python nên job cài thêm bằng apk; entrypoint: [''] cần thiết vì entrypoint mặc định của image là lệnh jmeter, GitLab Runner sẽ không chạy được shell script.
# best practices
# thiết kế test plan
- Dùng Transaction Controller nhóm related requests, đo đúng business operation time
- Thêm Think Time giữa requests (1-5s), mô phỏng user thực, không phải DDoS
- Parameterize mọi thứ: host, port, threads, duration từ properties → dùng lại được
- Tách test data vào CSV, không hardcode trong test plan
- Disable View Results Tree khi chạy thực, tốn memory, chỉ dùng debug
# chạy test
- Luôn chạy CLI mode cho test thực tế, GUI chỉ để design
- Warm-up server trước khi đo, chạy 1-2 phút tải nhẹ trước
- Ramp-up đủ chậm: tránh thundering herd effect
- Chạy đủ lâu: tối thiểu 5-10 phút cho load test, 1-4 giờ cho soak test
- Chạy nhiều lần: 1 lần chạy không đủ tin cậy, chạy 3 lần lấy trung bình
# phân tích kết quả
- Xem P95/P99 thay vì average, average che giấu long tail latency
- Correlate với server metrics: JMeter chỉ cho client view, cần server-side monitoring
- So sánh với baseline: lưu kết quả mỗi lần, so sánh regression
- Tìm saturation point: throughput không tăng dù thêm threads = server saturated
- Kiểm tra resource: CPU, memory, disk I/O, network trên server khi test
# sai lầm thường gặp
| Sai lầm | Hậu quả | Cách đúng |
|---|---|---|
| Chạy JMeter trên cùng máy với server | Kết quả sai (cạnh tranh resource) | Tách riêng machines |
| Không có think time | Tải không thực tế, server overwhelm | Thêm 1-5s random delay |
| Test trên localhost | Bỏ qua network latency | Test trên staging environment |
| Quá nhiều Listeners | JMeter OOM, kết quả sai | Chỉ giữ Summary/Aggregate, log ra .jtl |
| Không monitor server | Chỉ biết "chậm" không biết "tại sao" | Kết hợp Prometheus + Grafana |
| Ramp-up = 0 | Tất cả threads bắn cùng lúc = spike test | Ramp-up = threads/5 ~ threads/10 |
# checklist trước khi load test
□ Test plan đã được review và debug ở GUI mode (5-10 requests)
□ Assertions đúng (status code, response body)
□ Think time hợp lý (1-5s)
□ CSV data đủ dùng cho số threads × loops
□ Token/auth mechanism hoạt động (Once Only Controller)
□ Target server là staging/performance environment (KHÔNG phải production)
□ Server monitoring đã bật (Prometheus, Grafana, APM)
□ Database đã seed đủ data thực tế
□ JMeter machine có đủ resource (RAM, CPU, network)
□ Firewall/proxy không throttle
□ Team đã thông báo (tránh ai đó nghĩ server bị attack)
□ Có baseline metrics để so sánh
□ Kết quả sẽ được lưu lại (artifacts, reports)
# lời kết
| Giai đoạn | Công cụ/Kỹ thuật |
|---|---|
| Thiết kế test | JMeter GUI + Plugins (Ultimate Thread Group) |
| Chạy test | JMeter CLI + properties parameterization |
| Monitor server | Spring Actuator + Prometheus + Grafana |
| Monitor JMeter | InfluxDB Backend Listener + Grafana |
| Phân tích | HTML Report + Aggregate Report + custom scripts |
| CI/CD | GitLab CI + Docker image + threshold check script |
| Tối ưu | HikariCP tuning, Redis cache, Async, JVM tuning |
JMeter chỉ cho bạn góc nhìn từ phía client. Phải đặt nó cạnh metric phía server (Actuator, Prometheus, Grafana) thì mới biết chậm ở đâu và vì sao. Bắt đầu nhỏ thôi: một load test cho API quan trọng nhất, lưu kết quả làm baseline, rồi đưa vào pipeline chạy định kỳ để bắt regression trước khi lên production.
Chỉ là những ghi chép cá nhân với hy vọng mang lại chút giá trị. Nếu thấy hữu ích, đừng ngại chia sẻ cho bạn bè & đồng nghiệp nhé!
Happy coding 😎 👍🏻 🚀 🔥.